
Introduction
Profit matters—but efficiency matters even more. That’s where the roa formula steps in. It doesn’t just tell you how much a company earns; it shows how effectively it uses its assets to generate profit.
If you’ve ever wondered whether a company is truly making the most of what it owns—its equipment, cash, buildings, or inventory—this metric gives you a clear answer. Investors rely on it. Analysts reference it constantly. Business owners track it to understand performance trends.
In simple terms, the roa formula measures how well a company turns its total assets into net income. And once you understand it, you’ll start seeing financial statements in a completely different way.
What Is the ROA Formula?
At its core, Return on Assets (ROA) measures profitability relative to total assets. It answers one essential question:
How much profit does a company generate for every dollar of assets it owns?
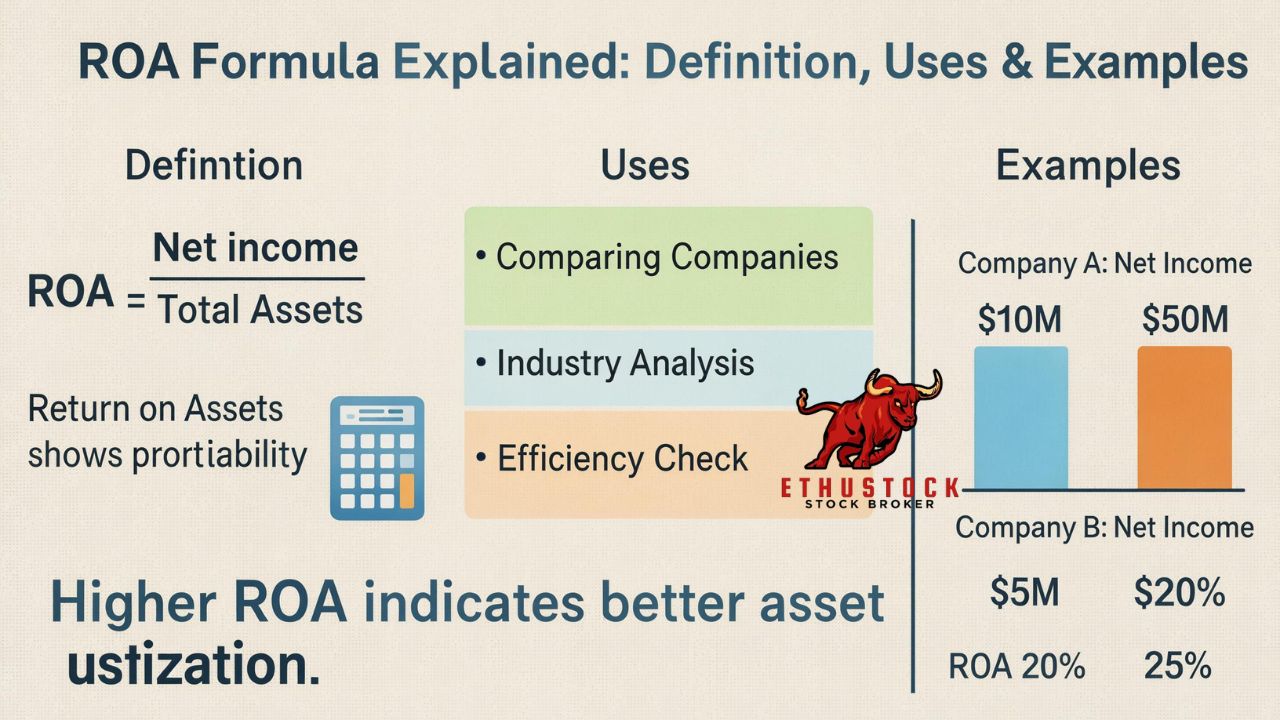
The roa formula is:
ROA = Net Income ÷ Total Assets
This result is typically expressed as a percentage.
For example, if a company earns $100,000 in net income and has $1,000,000 in total assets:
ROA = 100,000 ÷ 1,000,000 = 0.10 = 10%
That means the company generates 10 cents of profit for every dollar invested in assets.
Why This Metric Matters
Unlike revenue or net profit alone, ROA puts profitability into context. It considers:
- Asset base
- Operational efficiency
- Management effectiveness
- Capital intensity
It helps answer whether a company is productive—or simply large.
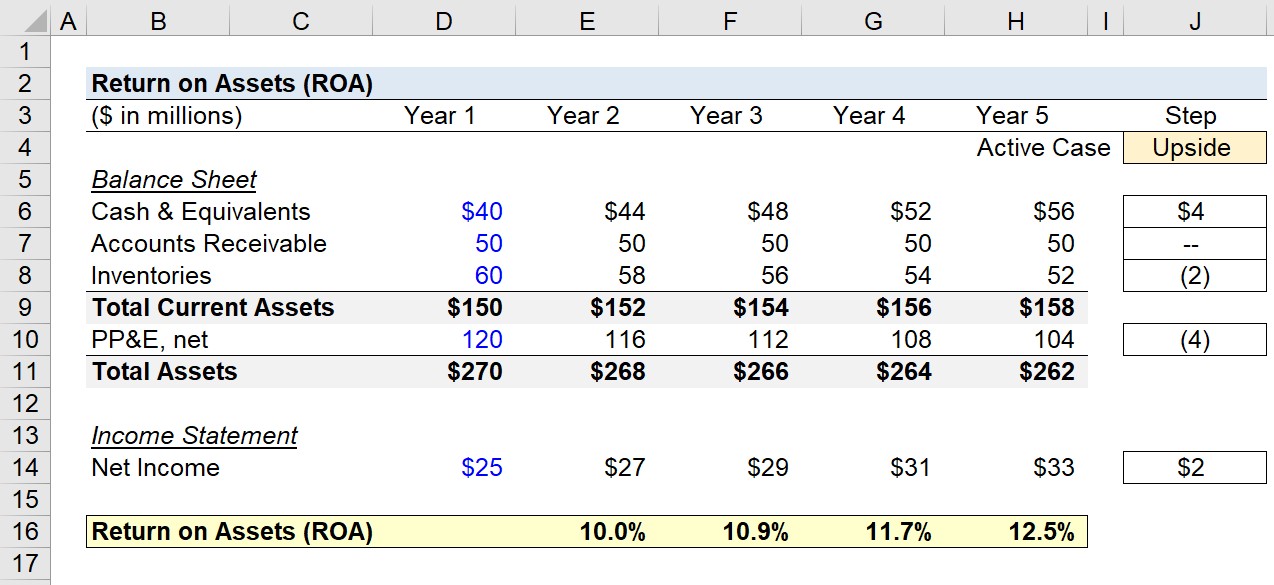
After understanding the basic definition, it helps to visualize how the calculation works in practice.

Breaking Down the Components of the ROA Formula
To fully understand the roa formula, you need to examine its two components.
Net Income
Net income is the company’s profit after:
- Operating expenses
- Interest
- Taxes
- Depreciation
It’s found at the bottom of the income statement—often called “the bottom line.”
This number reflects what remains for shareholders after all obligations are paid.
Total Assets
Total assets appear on the balance sheet and include:
- Cash and cash equivalents
- Inventory
- Accounts receivable
- Property, plant, and equipment
- Intangible assets
Assets represent everything the company owns or controls that has economic value.
When you divide net income by total assets, you’re essentially asking:
How efficiently are these assets producing profit?
How to Calculate ROA Step by Step
Let’s walk through a structured example.
Step 1: Find Net Income
Locate the income statement and identify net income.
Example:
Net Income = $250,000
Step 2: Find Total Assets
Look at the balance sheet.
Total Assets = $2,500,000
Step 3: Apply the ROA Formula
ROA = 250,000 ÷ 2,500,000 = 0.10
Multiply by 100:
ROA = 10%
That’s it. The math is simple—but the interpretation requires context.
What Is Considered a Good ROA?
There’s no universal “good” number. It depends on the industry.
Asset-Light Industries
Examples:
- Technology
- Consulting
- Software
These businesses often have higher ROA (10%–20% or more) because they don’t require heavy physical assets.
Asset-Heavy Industries
Examples:
- Manufacturing
- Airlines
- Utilities
These industries typically show lower ROA (2%–8%) due to expensive infrastructure.
Comparing ROA across industries without context can lead to incorrect conclusions.
ROA vs Other Profitability Ratios
Understanding the roa formula becomes clearer when compared to similar metrics.
ROA vs ROE (Return on Equity)
- ROA measures return on total assets.
- ROE measures return on shareholders’ equity only.
ROE can appear higher because it excludes debt. ROA includes all assets regardless of financing.
ROA vs ROI (Return on Investment)
- ROI is broader and can apply to specific projects.
- ROA measures overall company efficiency.
ROA vs Profit Margin
Profit margin shows how much profit comes from revenue.
ROA shows how efficiently assets generate that profit.
Each metric answers a different question. Together, they provide a full picture.
Why Investors Pay Close Attention to ROA
Investors use ROA to:
- Compare companies within the same industry
- Identify operational efficiency
- Detect poor asset utilization
- Spot long-term trends
A consistently rising ROA often signals improving management performance.
A declining ROA may indicate:
- Overinvestment in assets
- Declining profitability
- Inefficient operations
It’s not just about one year’s number—it’s about patterns.
Adjusted and Average Asset Variations
Sometimes analysts modify the roa formula slightly.
Using Average Total Assets
Instead of year-end assets, some prefer:
ROA = Net Income ÷ Average Total Assets
Average Total Assets = (Beginning Assets + Ending Assets) ÷ 2
This smooths out seasonal fluctuations and large asset purchases.
Operating Income Variation
Some analysts use operating income instead of net income to remove financing effects.
Each variation serves a specific analytical purpose.
Common Mistakes When Using ROA
Even though the roa formula is simple, misinterpretation is common.
Comparing Across Different Industries
Asset intensity varies widely. Always compare companies within the same sector.
Ignoring Debt Levels
High debt increases assets and can reduce ROA.
Overlooking Accounting Differences
Depreciation methods and asset valuation can distort comparisons.
Understanding the context behind the numbers is critical.
Real-World Example of ROA in Action
Imagine two companies:
Company A:
Net Income = $500,000
Total Assets = $5,000,000
ROA = 10%
Company B:
Net Income = $700,000
Total Assets = $10,000,000
ROA = 7%
Company B earns more profit—but Company A uses assets more efficiently.
This distinction is why analysts don’t look at profit alone.
How Businesses Can Improve ROA
Improving ROA requires one of two actions:
- Increase net income
- Reduce total assets
Strategies include:
- Improving operational efficiency
- Cutting unnecessary asset purchases
- Selling underperforming assets
- Increasing pricing power
- Managing inventory better
Strong asset management directly impacts ROA.
Limitations of the ROA Formula
No metric is perfect.
ROA does not:
- Reflect market value
- Account for growth potential
- Show cash flow health
- Capture qualitative factors
It should always be used alongside:
- Cash flow analysis
- Debt ratios
- Profit margins
- Revenue growth metrics
Financial analysis is about context—not isolated numbers.
FAQ
Frequently Asked Questions
What does the roa formula measure?
It measures how efficiently a company uses its total assets to generate net income.
Is a higher ROA always better?
Generally yes, but only when comparing companies in the same industry.
Can ROA be negative?
Yes. If a company has a net loss, ROA becomes negative.
Why do banks typically have lower ROA?
Banks operate with large asset bases and high leverage, naturally lowering ROA percentages.
Should investors rely only on ROA?
No. It should be used alongside other financial ratios for complete analysis.
Is ROA useful for small businesses?
Absolutely. It helps small business owners understand asset efficiency and operational productivity.
How often should ROA be calculated?
Most analysts calculate it annually, though quarterly analysis can reveal short-term trends.
Conclusion
The roa formula may look simple, but its insight is powerful. It connects profitability to efficiency—revealing whether a company is truly making the most of its resources.
For investors, it’s a quick way to compare operational strength. For business owners, it’s a performance compass. And for students of finance, it’s one of the foundational metrics that brings financial statements to life.
When used thoughtfully and in context, ROA transforms numbers into meaningful insight.